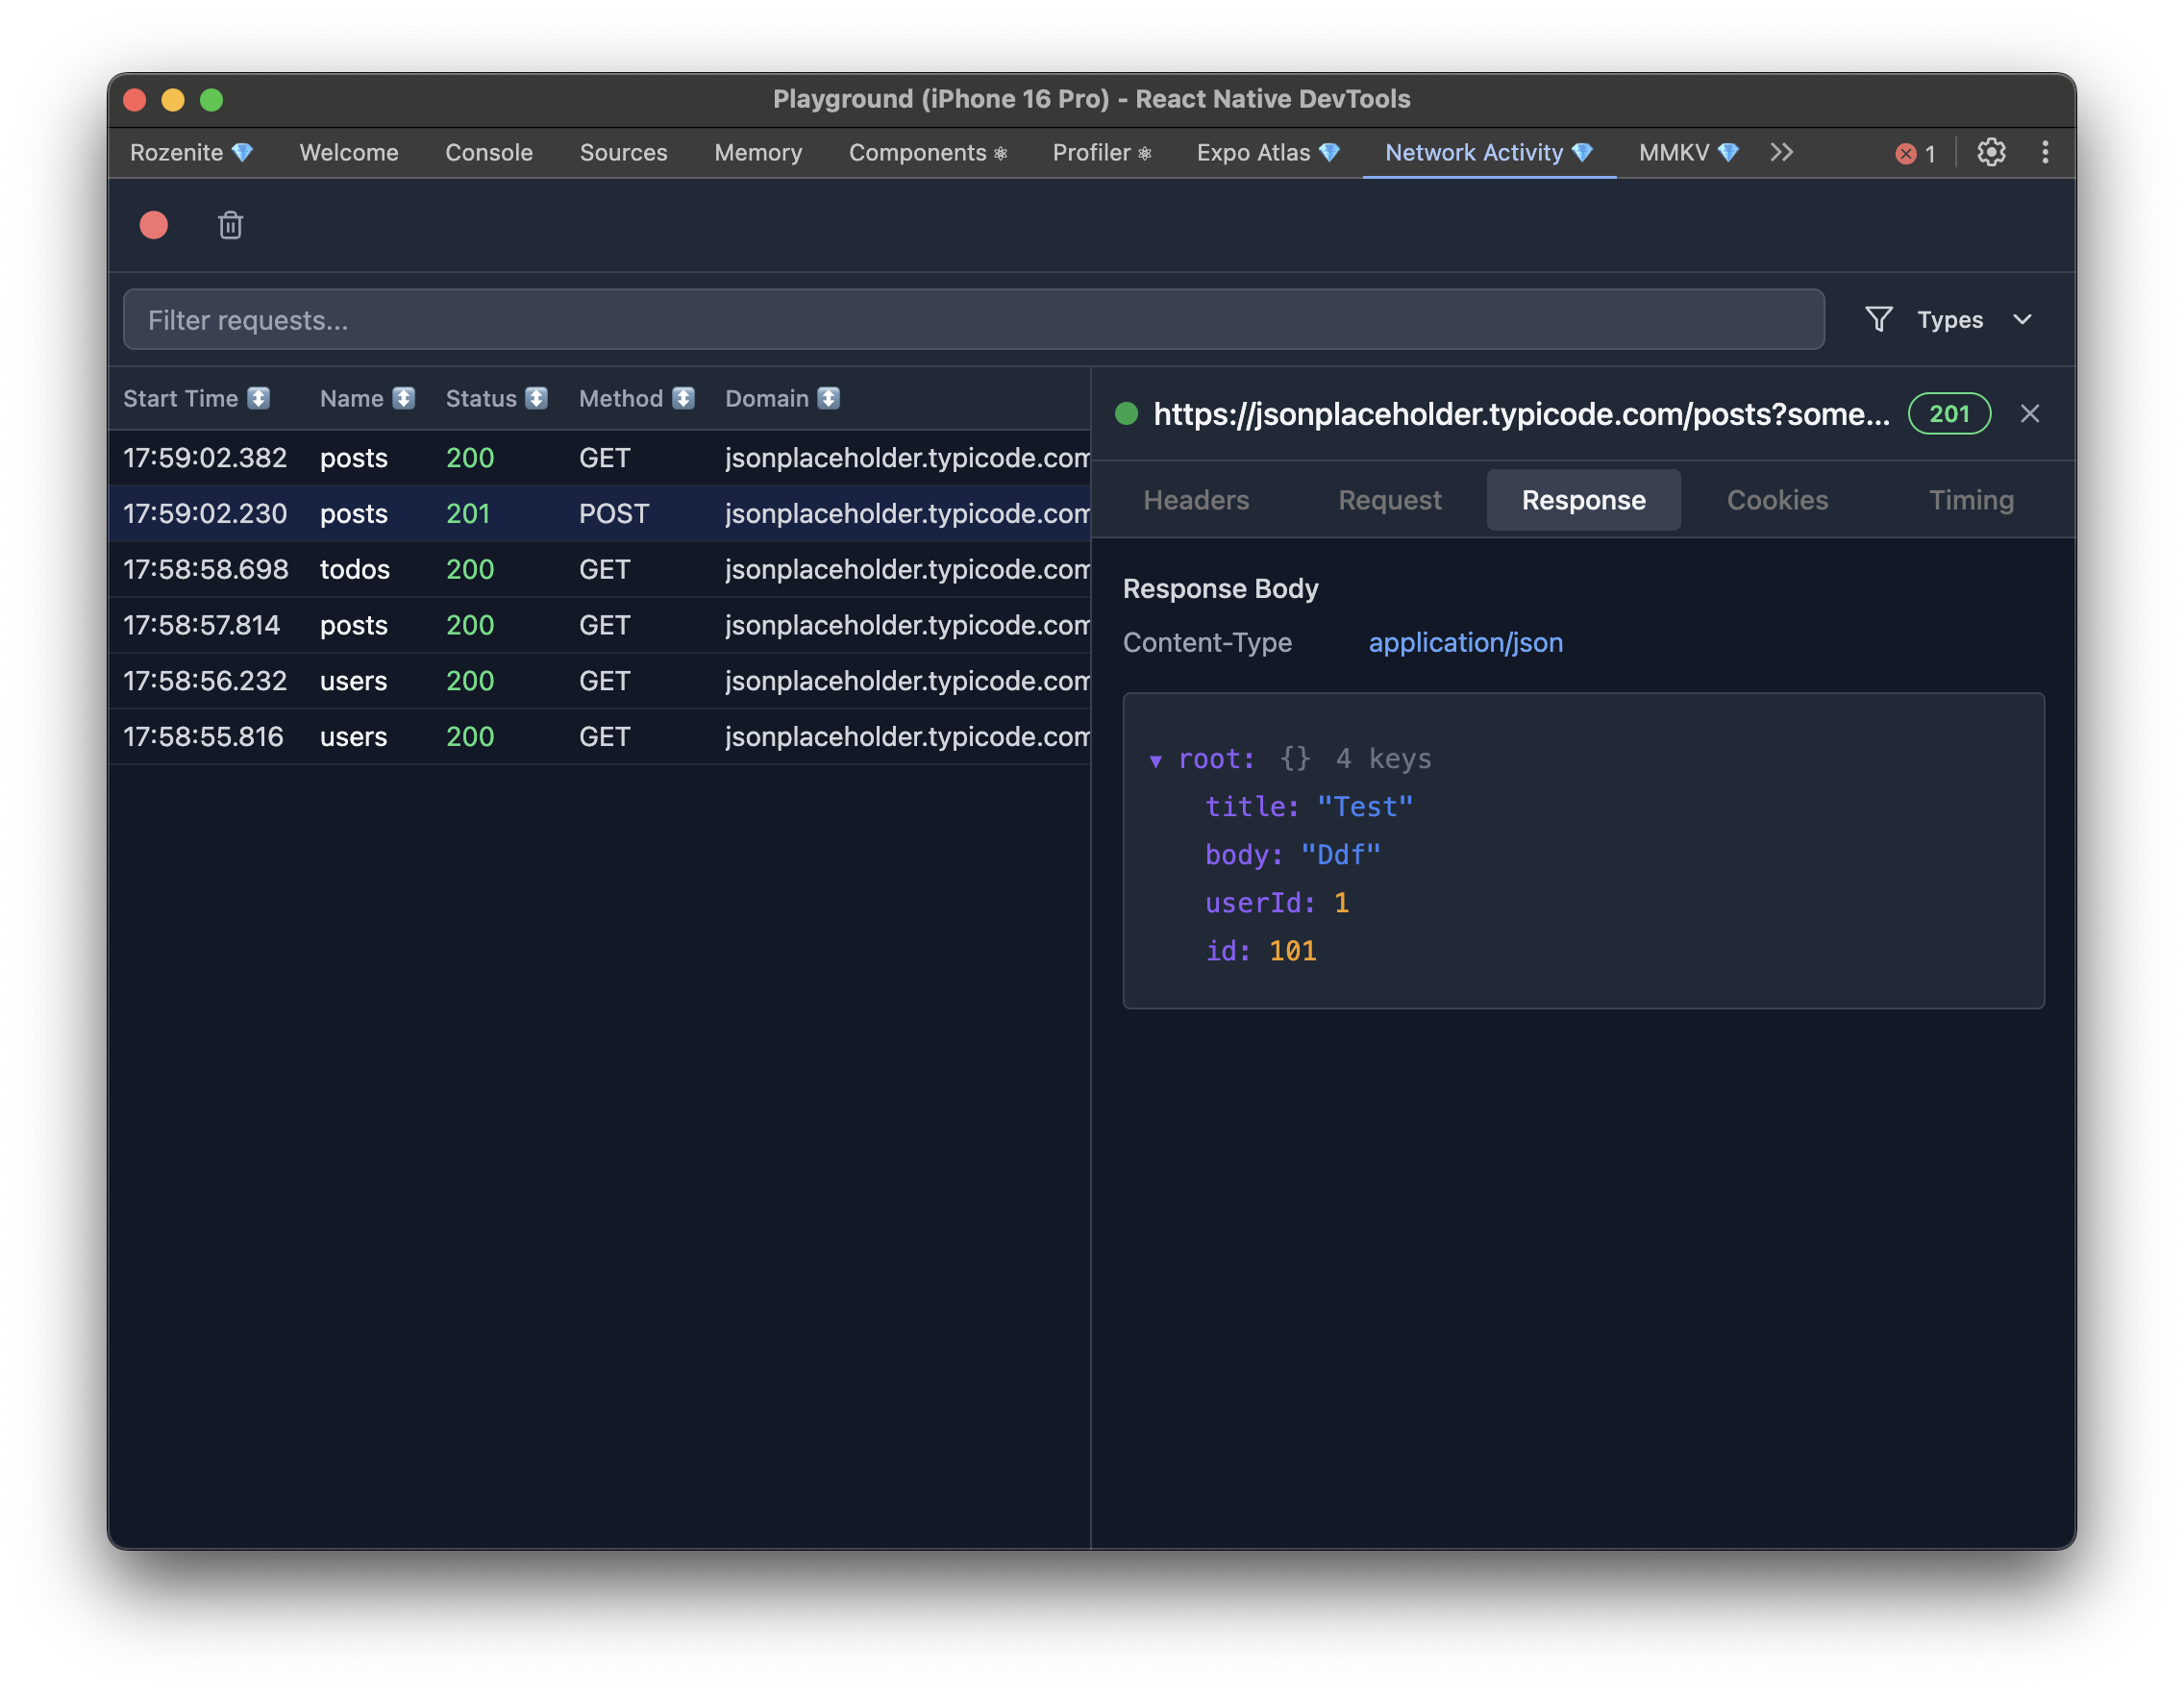
Network Activity Plugin

The Network Activity plugin provides comprehensive network request monitoring for React Native applications, offering real-time network debugging capabilities similar to Chrome DevTools Network panel.
What is Network Activity Plugin?
The Network Activity plugin is a powerful debugging tool that helps you monitor and analyze all network requests in your React Native application. It provides:
- Real-time Network Monitoring: Track all HTTP/HTTPS requests as they happen
- Request Details: View request headers, method, URL, and timing information
- Response Inspection: Examine response headers, status codes, and timing data
- Performance Analysis: Analyze request duration, connection timing, and performance metrics
- Request History: Maintain a searchable history of network activity
The Network Activity plugin will only capture network traffic coming from the JavaScript thread. Connections made by native code (such as native networking libraries or direct platform HTTP calls) won't be displayed in the inspector.
Installation
Make sure to go through the Getting Started guide before installing the plugin
Install the Network Activity plugin as a development dependency using your preferred package manager:
Add the DevTools hook to your React Native app to enable network monitoring:
To capture network requests happenning before your React Native app initialization, add this to your entrypoint:
Usage
Once configured, the Network Activity plugin will automatically appear in your React Native DevTools sidebar as "Network Activity". Click on it to access:
Network Request List
- Real-time Updates: See network requests as they happen in your app
- Request Status: View request status (pending, completed, failed)
- HTTP Methods: Identify GET, POST, PUT, DELETE, and other HTTP methods
- Response Codes: See HTTP status codes and their meanings
- Request Timing: Monitor request duration and performance
Request Details
- Headers: Inspect request and response headers
- Query Parameters: View URL parameters and their values
- Request Body: Examine POST/PUT request payloads
- Response Body: View response content and structure
Configuration
Ignoring Certain Types of Traffic
Sometimes you don't want certain types of traffic like WebSockets or server-side events to show up in the inspector for convenience or because of the performance penalty. You can disable them with the configuration property:
Available Inspector Types
http: Monitor HTTP/HTTPS requests (fetch, XMLHttpRequest)websocket: Monitor WebSocket connections and messagessse: Monitor Server-Sent Events (requireshttpto be enabled)
Contributing
The Network Activity plugin is open source and welcomes contributions! Check out the Plugin Development Guide to learn how to contribute or create your own plugins.
Support
If you encounter issues with the Network Activity plugin:
- Check Documentation: Review this guide for common solutions
- Search Issues: Look for similar issues in the repository
- Create Issue: Report bugs or request features
- Community: Reach out to the Rozenite community for help
Next: Learn about Plugin Development to create your own plugins, or explore other Official Plugins.
