Performance Monitor Plugin
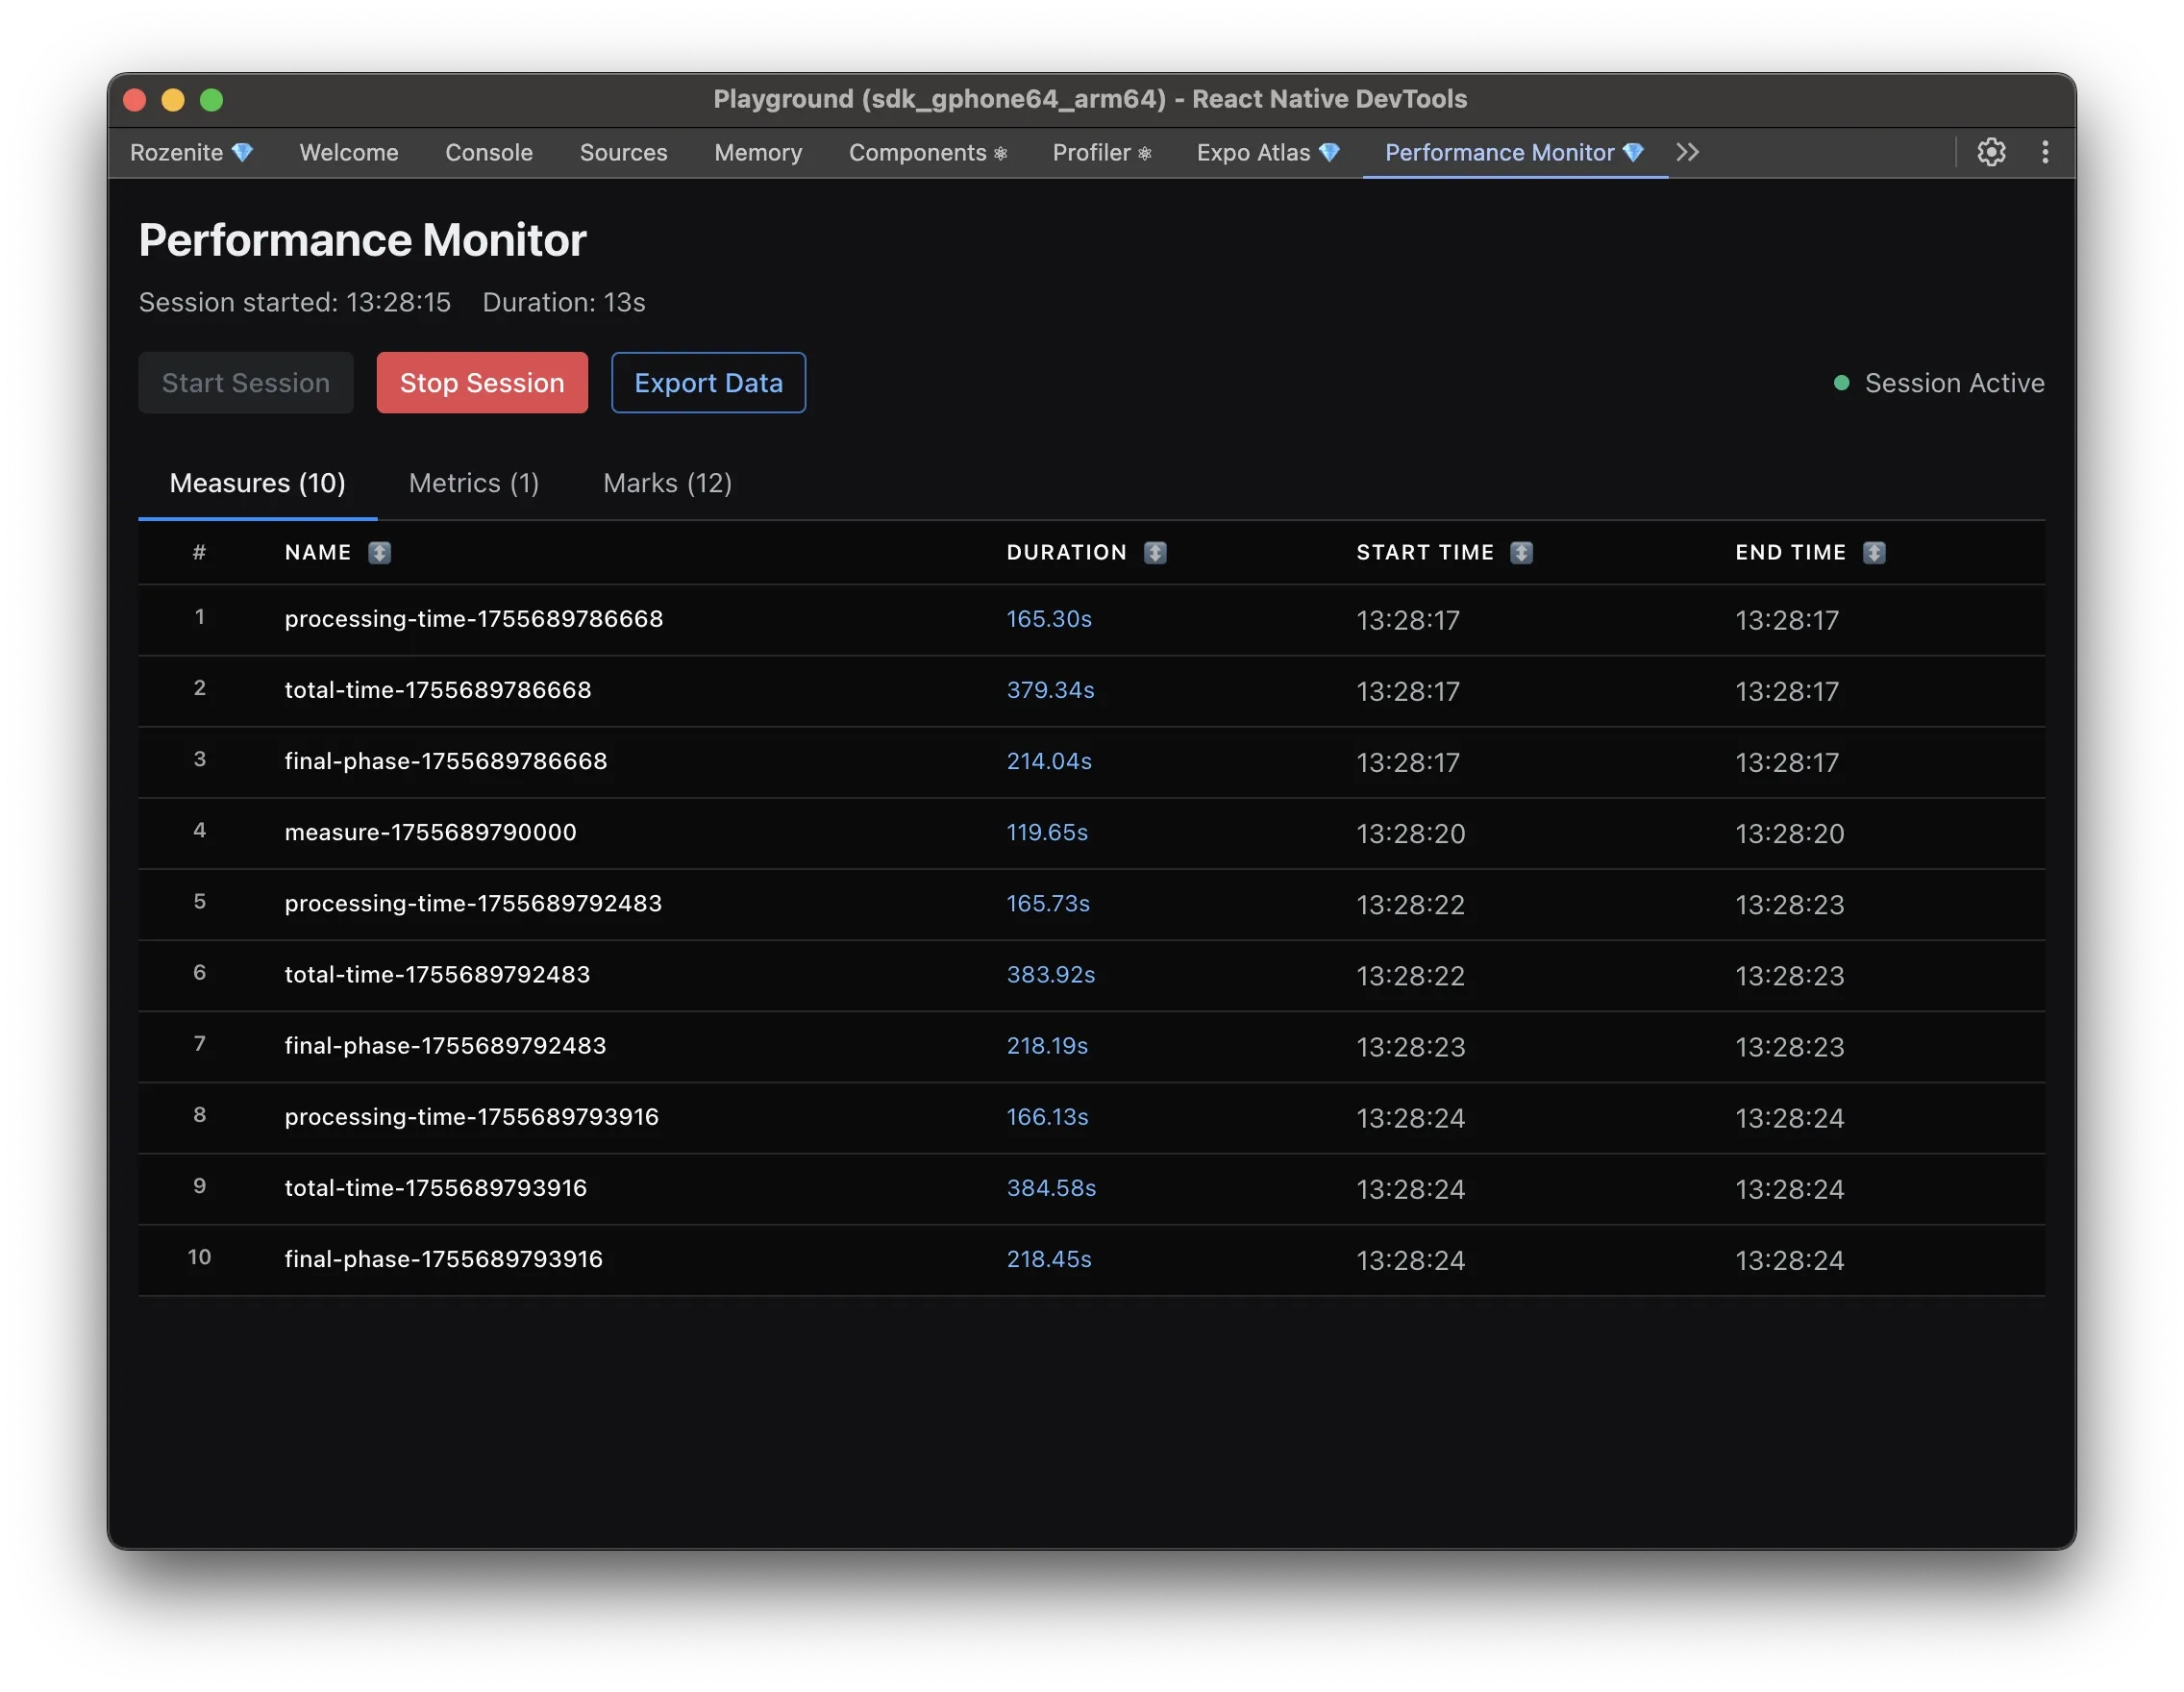
The Performance Monitor plugin shows startup timing and performance marks in React Native DevTools. It’s built on the react-native-performance library, so anything you already mark or measure with it shows up automatically.
Installation
Section titled “Installation”Make sure to go through the Getting Started guide before installing the plugin.
npm install -D @rozenite/performance-monitor-plugin react-native-performanceyarn add -D @rozenite/performance-monitor-plugin react-native-performancepnpm add -D @rozenite/performance-monitor-plugin react-native-performancebun add -D @rozenite/performance-monitor-plugin react-native-performanceimport { usePerformanceMonitorDevTools } from '@rozenite/performance-monitor-plugin';
function App() { usePerformanceMonitorDevTools();
return <YourApp />;}Web (React Native for Web)
Section titled “Web (React Native for Web)”With Rozenite for Web, this plugin is also available when debugging your React Native web app.
Once configured, “Performance Monitor” appears in your React Native DevTools sidebar.
Startup
Section titled “Startup”The first tab you see breaks down your app’s launch time: native initialization, JS bundle parse/execute, and the first React render. It populates automatically as soon as you start a session — no instrumentation needed. A phase shows “In progress…” while it’s still running, or “—” if your app’s architecture doesn’t report it.
Custom marks and measures
Section titled “Custom marks and measures”Add your own marks, measures, and metrics from anywhere in your app using react-native-performance directly — they show up in the panel in real time:
import performance from 'react-native-performance';
performance.mark('app-start');performance.mark('data-loaded');performance.measure('app-initialization', 'app-start', 'data-loaded');performance.metric('custom-metric', 42, { detail: 'Additional info' });- Marks are named points in time — e.g.
user-login-complete. - Measures are durations between two marks — e.g. the time between
login-startandlogin-end. - Metrics are arbitrary values you want to track, e.g.
performance.metric('memory-usage', 1024, { unit: 'MB' }).
Sessions
Section titled “Sessions”Start and stop a monitoring session from the panel, and export what it captured for further analysis.
Next: Learn about Plugin Development, or explore other Official Plugins.