Require Profiler Plugin
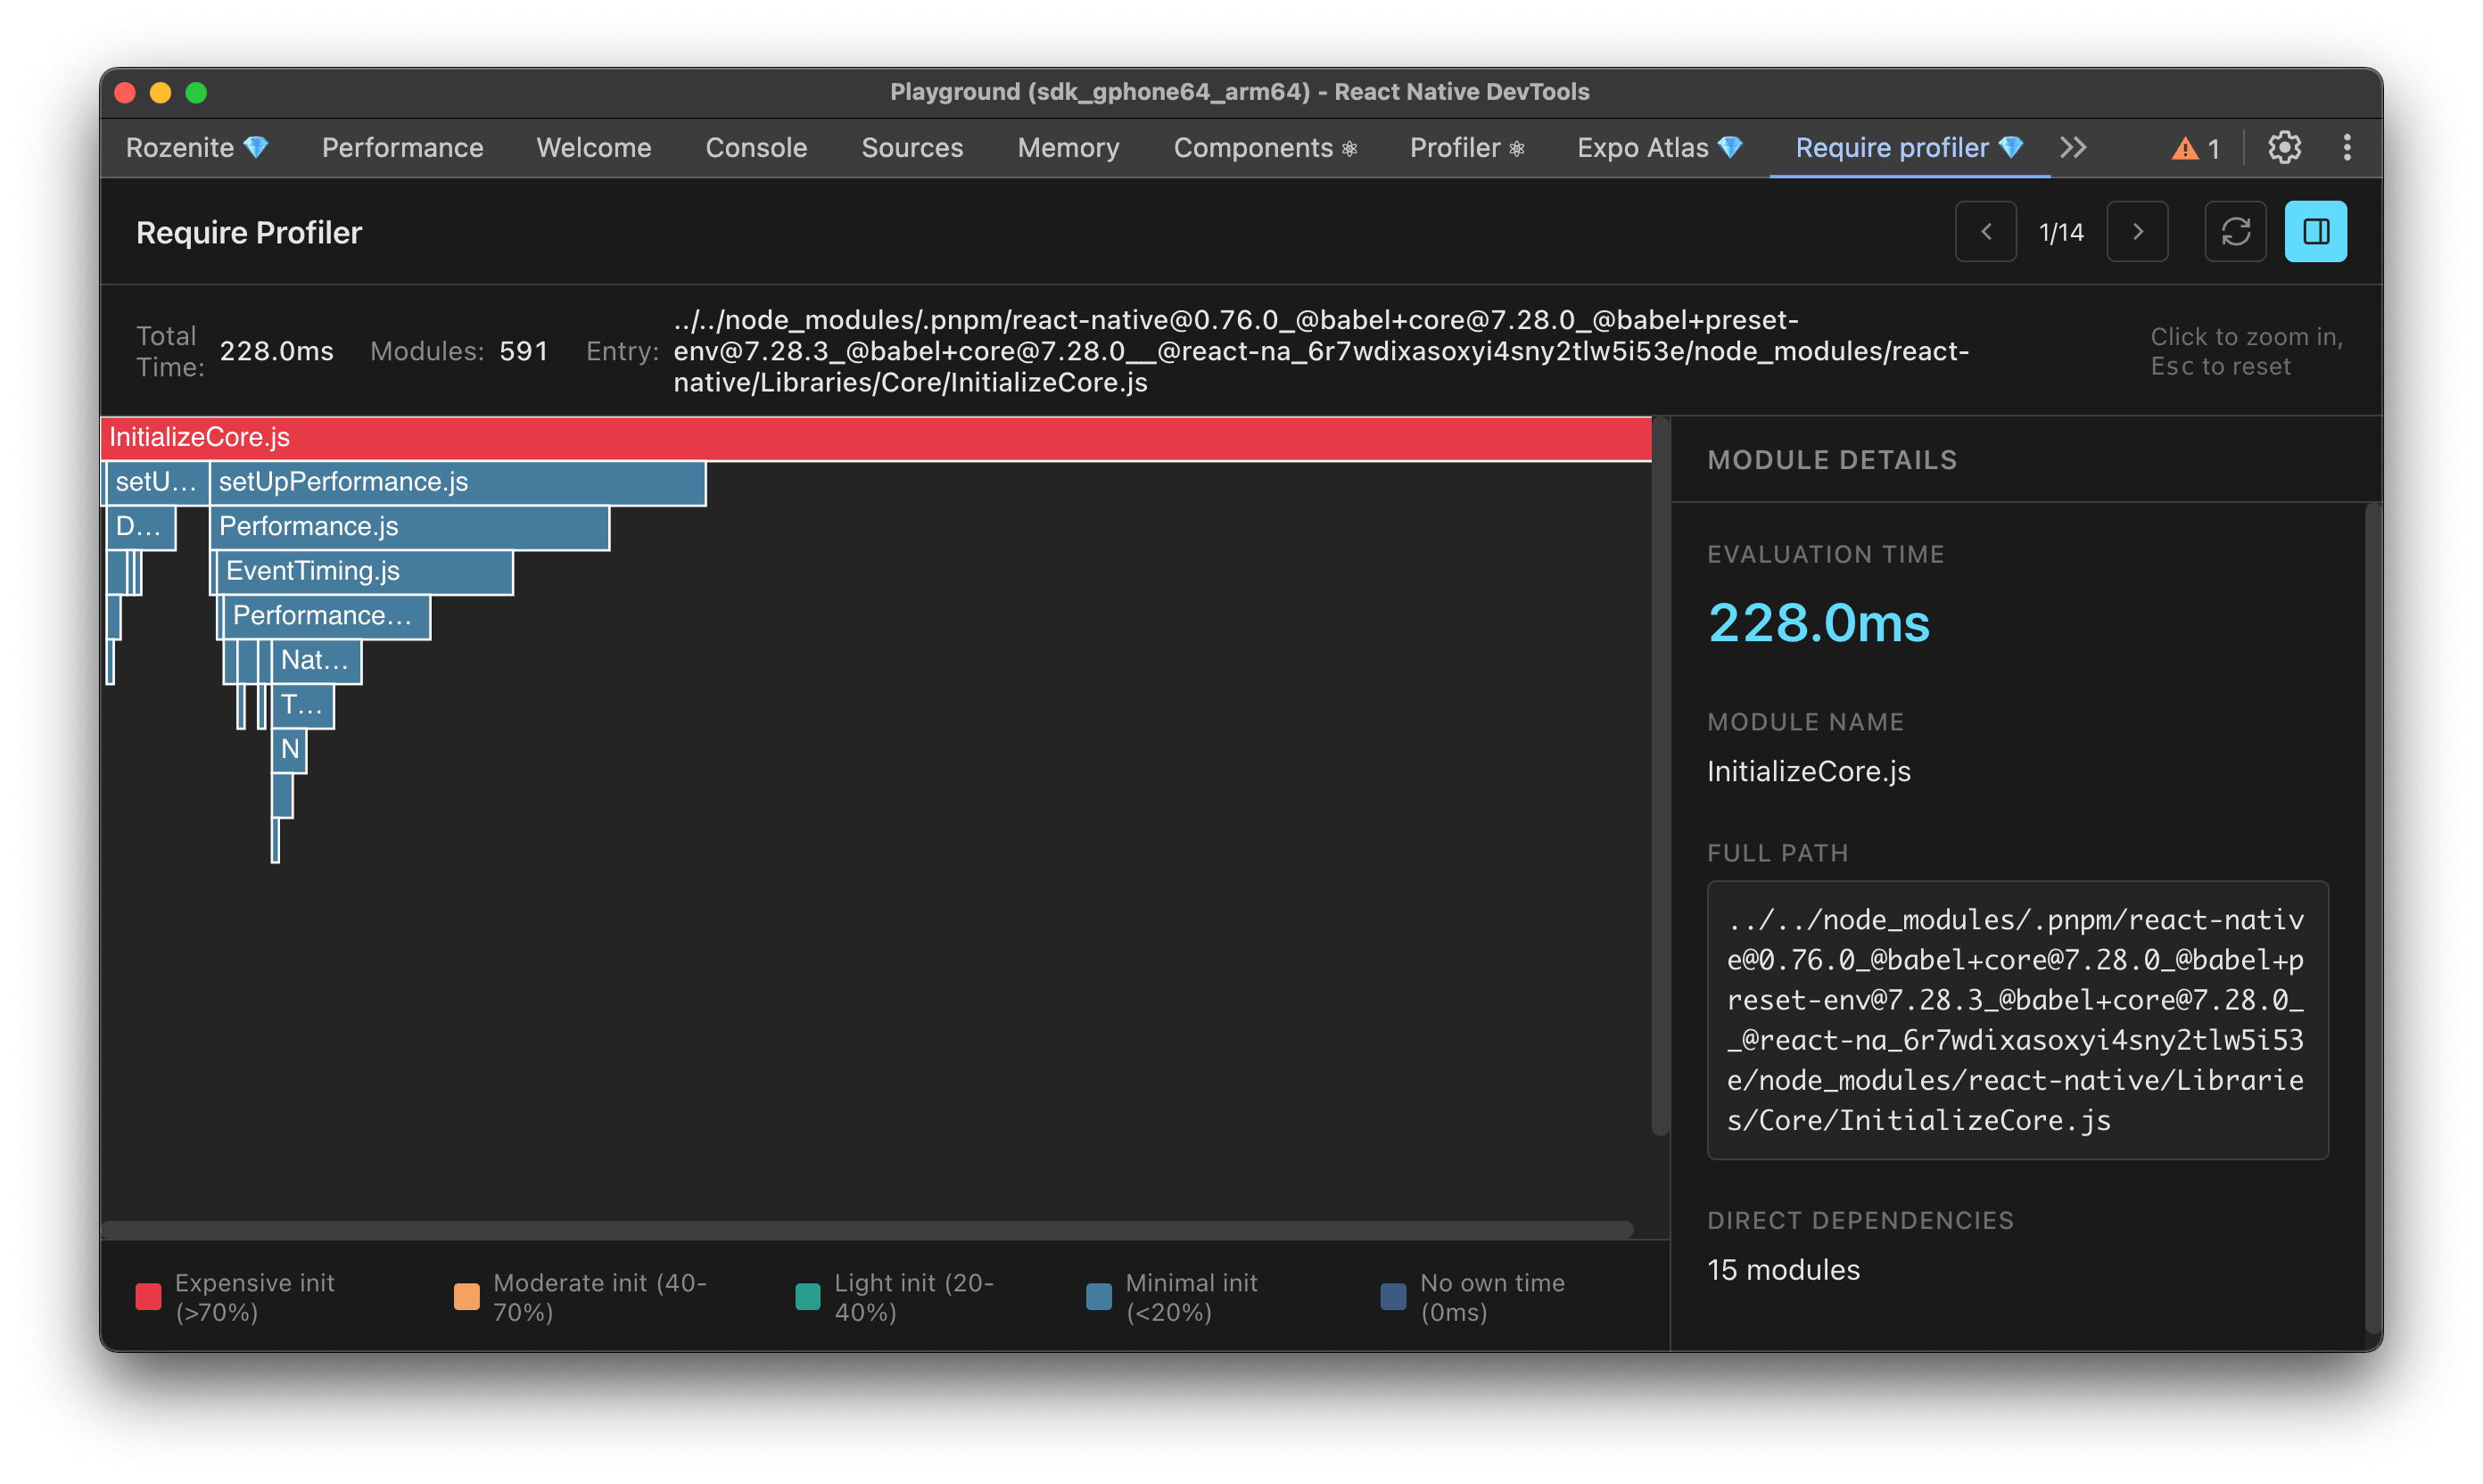
The Require Profiler plugin tracks how long each require() call takes while your app starts up, and shows the result as a flame graph — so you can see exactly which modules are slowing down your app's Time to Interactive.
Installation
Make sure to go through the Getting Started guide before installing the plugin.
Enable the Metro instrumentation:
Keep withRozenite's enabled option conditional as above — when it is false,
enhanceMetroConfig never runs and nothing is instrumented. The profiler also
defends itself for the cases outside that gate: it skips instrumentation when
process.env.NODE_ENV is production, and the polyfill it injects is guarded by
__DEV__, which Metro strips from release bundles. Pass enabled to override the
default:
Add the DevTools hook to your app:
Usage
Once configured, "Metro Require Profiler" appears in your React Native DevTools sidebar, showing a flame graph of every module loaded during startup.
- Color reflects self time: red modules spent over 70% of the heaviest module's own time; grey modules have no own time at all.
- Click a frame to zoom into that part of the tree, and press
Escapeto zoom back out. The detail panel shows self time, total time, dependency count, and the full path. - Top modules shows the same chain as a table ranked by self time — usually the fastest way to find the module worth fixing. Switch Group by to Packages to roll it up per npm package, which is the granularity you actually make decisions at: one row reading
lodash — 340ms across 87 modulesbeats 87 rows of 4ms each. Each package reports its own evaluation time and, separately, its cost including everything it pulled in. - Selecting a module shows the require chain that pulled it in, root-first and clickable — the answer to "why is this even loaded?".
- Packages evaluated from more than one install location are flagged. Two copies of a dependency cost evaluation time and bundle bytes twice, and with a stateful library they can break outright.
- Filter modules highlights matching frames in the graph and narrows the table.
- The sidebar lists every recorded chain with its duration and module count. Use the threshold selector to hide short chains — start around 100ms to focus on what actually matters for startup time.
What to look for
Wide, red, or deeply nested modules are your best candidates for optimization. Once you've found one that isn't needed immediately, defer it with a conditional or lazy require():
Re-run the profiler after each change to confirm the improvement and catch regressions.
Next: Learn about Plugin Development, or explore other Official Plugins.